


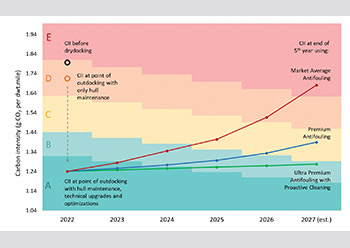
 Figure. 1: Carbon intensity factor over a 5-year dry docking period for different hull protection so
As ship owners rush to comply with Energy Efficiency Existing Ship Index (EEXI) requirements, Jotun, the Norwegian hull coatings manufacturer, said misguided decisions on “low friction” hull coatings can have far reaching consequences.
Jotun has created a tool to calculate the Carbon Intensity Indicator (CII) of individual vessels and project the expected development in CII ratings based on different antifouling coatings. The digital tool will display options in a way that customers can easily visualise.
Alongside the new tool, Jotun has published a paper that dispels the notion of “low friction” coatings that can improve vessel EEXI purely through theoretical calculations and adjustments. The findings are supported by vessel performance data analysed using the ISO 19030 standard.
 |
|
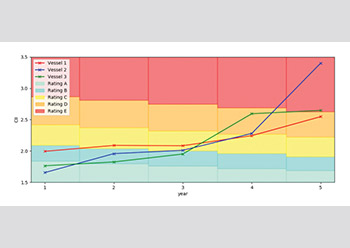
Figure. 2: Carbon Intensity correlation of 3 different sister vessels using available hull performance data |
The paper highlights that IMO guidelines clearly state that the effect of “low friction coatings” cannot be measured, calculated or certified in isolation. In the case of a sea trial, achieving low hull roughness requires the right surface preparation and skilled application, and not purely on choice of coating.
Should the vessel end up with an antifouling that claims “low friction” but is not effective in protecting the hull against biofouling, loss in vessel speed, increased fuel consumption and commercial consequences of poor CII ratings will be costly for the ship owner. Even as ship owners see EEXI compliance as the most pressing need, decisions taken now on hull coatings can significantly affect CII ratings for the next few years.
Hull coatings
Tan Keng Khoon, Global Category Manager for Hull Performance, explained: “We have built a digital tool to project, for individual vessels, the expected increase over time in carbon emissions for different antifouling coatings, against progressively tightening bands of CII ratings.”
Taking a 388K dwt bulk carrier with a momentary A-rated efficiency on leaving dry dock, the choice of antifouling for that dry docking will lead to very different scenarios (Figure 1). On a market average antifouling, the vessel’s CII rating shows an annual deterioration, falling short of its required CII by the end of the 4th year.
A premium antifouling keeps the vessel within regulatory expectations, while an ultra-premium antifouling with proactive cleaning delivers the best CII rating – much stricter requirements by the 5th year being the reason for the change from A- to B-rating.
The projection is supported by evidence from 3 sister vessels with consistent operational profiles. Performance data analysed using the ISO 19030 standard for measuring hull & propeller performance and compared with fuel consumption records confirms the drastic change in CII ratings over time due to the use of lower quality anti foulings (Figure 2). Biofouling growth adds significant frictional resistance to hulls, thus burning more fuel and releasing more carbon dioxide.
Effective hull coatings
In Figure 1, the improvements from dry docking effect of cleaning, blasting and recoating the hull alone are insufficient to get an improvement beyond the D rating band. The vessel needs significant retrofits and further optimisations to improve its efficiency to an A rating. These can cost upwards of hundreds of thousands of dollars in equipment upgrade, or opportunity cost in reduced cargo load. With a lower quality, average antifouling, this newly-gained A-rate efficiency is only momentary. As biofouling catches hold, it deteriorates to a C by the end of the 3rd year, D by the 4th, and E by the 5th. A poor decision on anti foulings practically negates the CII improvements expected from major investments in other aspects of vessel efficiency.
Ship owners, managers and consultants need to realise that all else being equal, a vessel’s CII will increase over time due to biofouling pressure. The graph in Figure 1 are upwards curves, and not flat, horizontal lines. Effective hull coatings are a requisite measure of any efficiency improvement plan, even more so when major investments will be put into retrofitting and upgrades.